Measuring Defensive Dependency in MLB
Which teams rely on their gloves the most?

Baseball is like a cruel fight in a forest, in which one combatant has to throw punches, the other has to try to parry them, and the trees are in the way all the time. The one fending off the punches unfortunately fails most of the time, either by getting punched out or by getting caught in a branch trying to evade. Some punchers are so fierce that they don’t need an intimidating forest to throw strikes effectively. But some rely on their forests when they need to, especially when their punches aren’t hitting, or when they themselves can’t parry when it’s their turn to take the heat.
Our question today is: Who has relied on their forests the most to succeed in these cruel fights? Or, more concretely: Which teams throughout history have had such a wide discrepancy between great defense and poor offense? And which pitching staffs have relied the most on their fielders for their success?
In order to find the answer, I created a stat called Fielding Dependency Rating+, or FDR+ for short.
Formula
FDR+ has two components:
Discrepancy between Fielding and Offense (F-O+)
Fielding and Offense are value stats that are expressed in the currency of runs, and are foundational elements of Fangraphs’ position player Wins Above Replacement (WAR). Fielding (or “fielding runs”) is measured by Outs Above Average, Ultimate Zone Rating, or Total Zone, whereas Offense is a combination of batting runs (based on weighted On-Base Average) and base running runs.
This is implemented by subtracting Offense from Fielding, so that larger positive numbers indicate a greater reliance on defense. This number is then roughly converted from runs to wins (i.e., divided by 10), adjusted to the average of all teams, and normalized so that 100 is average.
Fielding-Dependent Pitching (FDP+)
FDP-Wins is a nifty pitching stat that quantifies how many pitching wins a team earned through balls in play and handling base runners, rather than the “three true outcomes” that Fielding-Independent Pitching (FIP) measures. The formula is RA9-Wins minus FIP-Wins, which is a lot like if you subtracted pitching fWAR from pitching rWAR.
This number is already in the currency of wins, so all that’s done is adjusting to the average of all teams and normalizing so that 100 is average.
The final number is simply the average of F-O+ and FDP+, adjusted to 162 games. Thankfully, both of these components are already park- and league-adjusted, making comparisons between seasons much easier.
I crunched the numbers for every team since integration (1947), and found some interesting results.
Results
Here are the top 15 teams in FDR+ post-integration (W-L record in parentheses):
1986 St. Louis Cardinals (79-82) - 118
1998 Tampa Bay Devil Rays (63-99) - 115
1984 Minnesota Twins (81-81) - 113
1967 Chicago White Sox (89-73) - 113
1972 Cleveland Indians (72-84) - 113
2003 Los Angeles Dodgers (85-77) - 112
1999 Anaheim Angels (70-92) - 112
1969 New York Mets (100-62, won WS) - 112
2000 Colorado Rockies (80-82) - 112
1974 Atlanta Braves (88-74) - 111
1986 Chicago White Sox (72-90) - 111
1987 Chicago White Sox (77-85) - 111
2009 Cincinnati Reds (78-84) - 111
1964 Chicago White Sox (98-64) - 111
1966 St. Louis Cardinals (83-79) - 111
The 1986 Cardinals have far and away the largest FDR+ of any team since WWII. Their whopping 118 rating largely stems from them having a 122 F-O+ (+99 Fld, -152 Off), the largest such discrepancy amongst the nearly two thousand teams in the dataset.
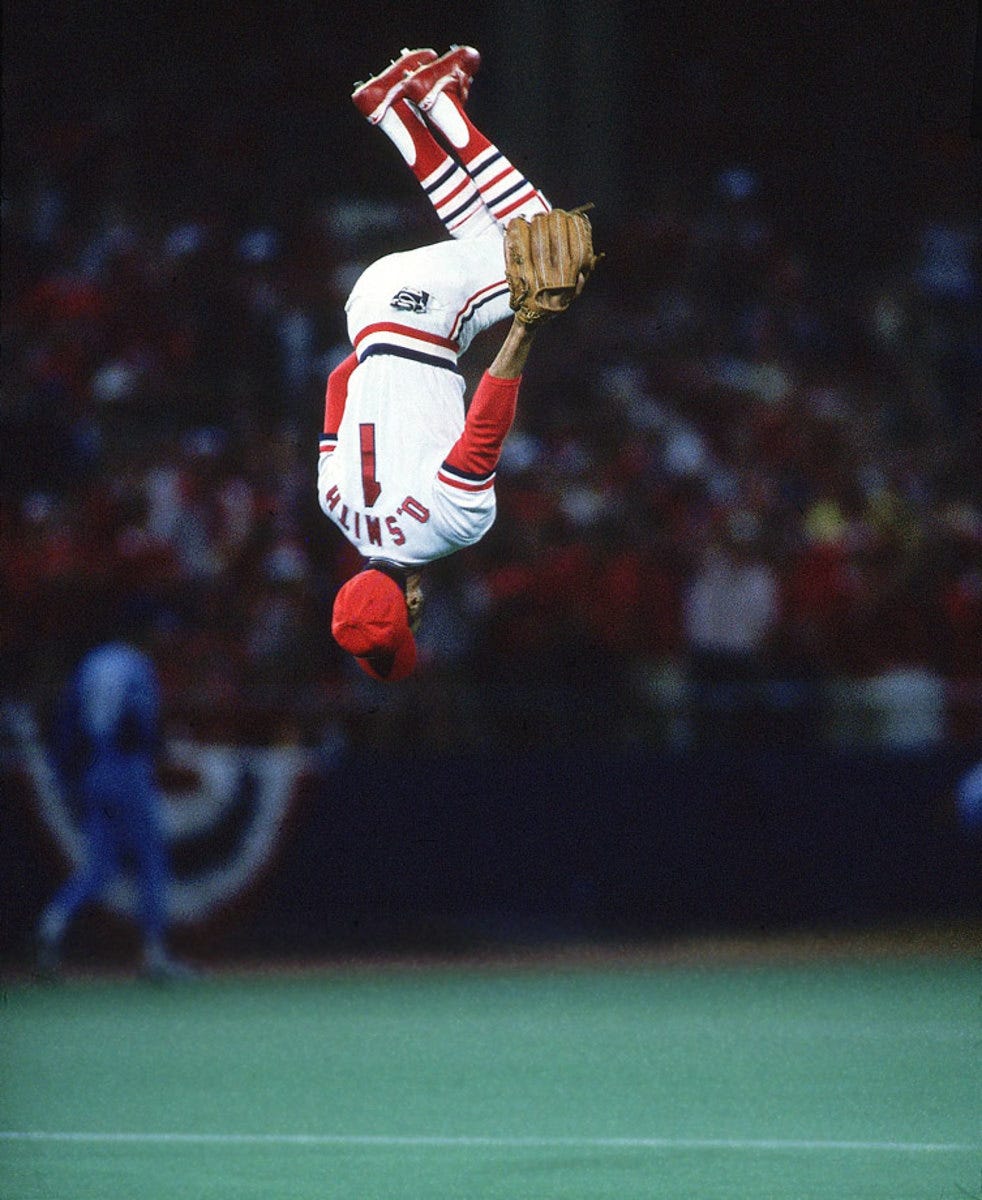
Led by the wizardly Ozzie Smith in his prime at shortstop, the ‘86 Cards fielded a pretty young lineup otherwise, including Andy Van Slyke, Vince Coleman, and Terry Pendleton. These slick fielders unfortunately struggled mightily at the plate, sporting a measly 76 wRC+ as a team and hitting only 58 home runs all year (bottom-25 post-integration). They also have the third-largest FDP+, indicating that their pitching staff led by John Tudor, Bob Forsch, Danny Cox and young closer Todd Worrell was highly effective at using their elite fielders to prevent way more runs than their peripherals would expect them to. Only them and the 1969 Mets have a top-10 FDP+ while also being top-10 in FDR+. Speaking of...
The Miracle Mets are the only top-15 team to make the postseason (poor ‘64 White Sox, who missed the World Series by one game). And not only did they make the postseason, but they also upset the behemoth Orioles to win the title. The freshly-minted Mets were not used to winning much until they caught fire in ‘69, with the help of elite pitching from Tom Seaver and Jerry Koosman (and a young Nolan Ryan in the bullpen!). Their lineup was highlighted by 26-year-olds Cleon Jones and Tommie Agee. Despite sporting only an 86 wRC+, their season was a masterclass in defensive run prevention. The only other World Series winners in the 95th percentile in FDR+ were the 1954 New York Giants (110) and the 1965 Los Angeles Dodgers (109).
Here are the bottom 15 teams in FDR+ post-integration (excluding 2020):
2005 New York Yankees (95-67, lost ALDS) - 83
2008 Texas Rangers (79-83) - 84
2003 Boston Red Sox (95-67, lost ALCS) - 85
1997 San Diego Padres (76-86) - 85
2001 Cleveland Indians (91-71, lost ALDS) - 86
2003 New York Yankees (101-61, lost WS) - 87
2002 New York Yankees (103-58, lost ALDS) - 87
1984 San Francisco Giants (66-96) - 87
1980 Texas Rangers (76-85) - 87
2004 New York Yankees (101-61, lost ALCS) - 88
1967 Houston Astros (69-93) - 88
1977 Chicago White Sox (90-72) - 88
2007 Tampa Bay Devil Rays (66-96) - 88
1979 California Angels (88-74, lost ALCS) - 88
2006 New York Yankees (97-65, lost ALDS) - 89
A few trends stand out when comparing the bottom 15 with the top 15. Firstly, the Yankees: Their post-dynasty shopping spree comprises a third of the spots on the list (their ‘07 squad nearly made the cut, too, and nearly 20% of the bottom 100 teams are Bronx Bombers). Also, the bottom 15 teams were more successful on average than the top 15, perhaps indicating that offense and three-true outcomes dominance really are more important for winning games. This correlation is not strong in general, though (r=-.06). Most notable of the ‘05 Yankees is their bottom-most 71 F-O+ (-144 Def, +119 Off), which is five points lower than anyone else.
Interestingly, FDR+ somewhat negatively correlates with year (r=-.13), revealing that more modern teams tend to be less fielding-dependent than older teams. Although I have no data to back up this claim, I suspect this is largely due to the increased talent pool fleshing out lineups more completely, resulting in a higher volume of hitting talent. Some of this trend may also be attributed to pitchers focusing more on getting strikeouts nowadays, thus relieving some of the pressure off their fielders. Another possible explanation is noise resulting from fielding metrics evolving to a much steeper degree over this time than hitting or pitching.
In terms of just the 2025 season, the Pirates sported the highest FDR+ at 108, with the Royals, Guardians and Rangers rounding out the top four with 105 each. At the bottom were the Mets at 91, with the Yankees (91), Mariners (92), and Dodgers (93) just in front of them.
Let’s now turn our attention to all-time (post-integration) franchise scores to see how much each ball club has historically depended on fielding for their success.
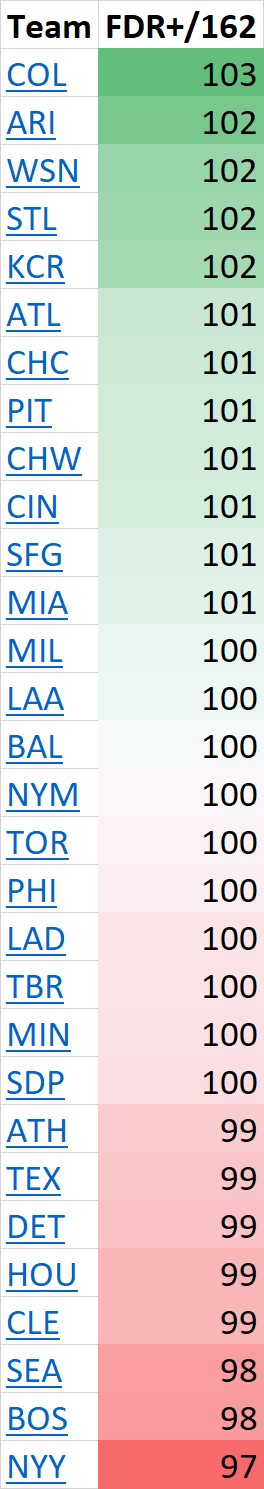
The Cardinals are near the top once again for the all-time list. This comes naturally for them upon having the most FDP-Wins over this time span. And given what we know from earlier, the Yankees at the nadir come as no surprise. But it’s NL expansion franchises that dominate the podium here, with the Rockies taking gold.
This may shock those familiar with Coors Field. How could such a notorious hitters’ paradise be home to the most fielding-dependent ball club? It’s not because of their pitchers, who have been bang-average in FDP+. Rather, it’s their F-O+, which is fourth highest. This may not sound convincing enough for first place until we remember the Rockies have only been around for a little over 30 years, less than half of the time since integration. To have accumulated the fourth highest F-O+ in such little time is quite the feat.
My theory as to why this is stems from the fact that their hitters always have a natural production boost from the mile-high air, which has likely influenced the front office to invest less in hitting. To clarify, it’s not the park factors themselves (since they are neutralized in these metrics), but the reaction to these factors through player development and acquisition. And it might not even be just front office reactions; players themselves may be negatively influenced by the inflationary effects of Coors, leaving the club with a hampered ability to sign talented hitters. This phenomenon is certainly present for pitchers, too. No wonder the Rockies’ GM position is the dream job of so many analysts in baseball—it provides unique challenges that no one has seemed to fully crack yet.
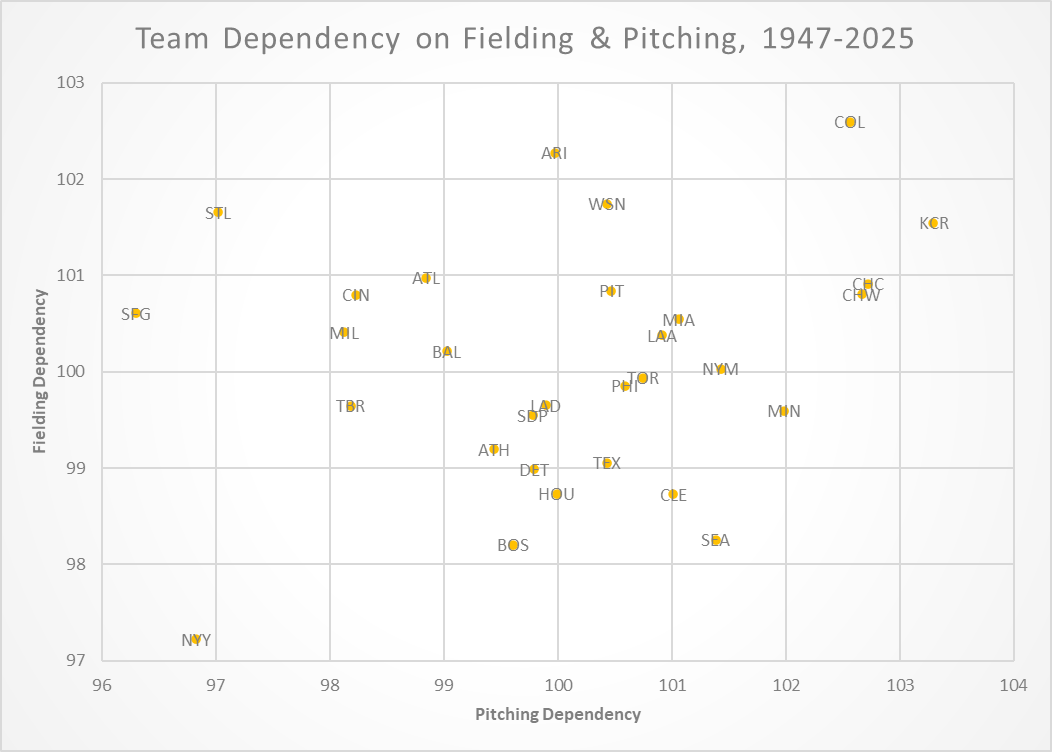
What I find most intriguing about this list is the ostensible discrepancy between the National League and the American League. All but two of the top 10 are NL clubs. All but one of the bottom 10 is an AL club, with the Astros having switched allegiances two decades ago. What’s going on there?
The Designated Hitter seems to be the culprit, with it being a key differentiator between the leagues for the majority of this period. It’s well-established that AL offenses were more potent on average from 1973 to 2022 because of the added hitting value. When sorting by FDP+, there isn’t a big sway either way, so it doesn’t seem like there are significant differences between the leagues when it comes to “pitching to your fielders.” The separation seems to prominently originate from F-O+, strengthening the theory that continuing to dedicate a spot in the lineup to your pitcher for half a century leads to persistent and tangible gaps in offensive firepower. With less runs per game comes a greater emphasis on each run to potentially be the decider, which in turn puts more pressure on the defense.
FDR+ can also be applied to players by including a positional adjustment for position players and a rate basis for FDP-Wins. Many of the top position players in FDR+ since integration are glove-first catchers like José Molina and Austin Hedges, whereas those at the bottom are slug-first legends like Ted Williams and Frank Thomas. This version of FDR+ (which is simply Defense minus Offense) is the backbone for the “For Glove and Country Award” from the Alternative MLB Awards handed out at the conclusion of the season. As for pitchers, one of the highest-rated starters in FDR+ is Jim Palmer, who accumulated more FDP-Wins than anyone during this time period thanks to his dominant control and reliable fielders in Baltimore throughout the 70s.
One last thing we can inspect is pitching dependency rating (PDR+), which is less complicated to calculate as it simply involves subtracting position player WAR from pitcher WAR (weighted to account for WAR allocation differences between the two). The Royals are historically the most pitching-dependent team since integration, with the Giants being the least.
There is a slight but not terribly significant positive correlation between FDR+ and PDR+ (r=.08), with the latter not displaying much of an AL vs NL disparity like the former does. However, there’s a much stronger negative correlation between PDR+ and winning percentage (r=-.35). The reason for this may be purely numerical: The sky is the limit for hitting (there are always more runs to score), but there’s a hard ceiling for pitching (0). With average runs per team per game usually being around 4, this hard ceiling means there’s only so much room for pitchers to positively deviate from average (i.e., ~4 runs), whereas there being no limit for how many runs hitters can score means they have theoretically infinite room for positive deviation.